 This post is one of a series of blog posts from the first ONA class of MJ Bear Fellows describing their experiences, projects and sharing their knowledge with the ONA community. Fellow Lucas Timmons is a data journalist and web producer for The Edmonton Journal in Edmonton, Alberta, Canada.
Google Fusion Tables is a great tool for journalists to create visualizations easily and quickly. Since its launch, many news organizations have done some innovative things with it. With a bit of education and the willingness to experiment, you can make your maps even more informative and interesting. The steps outlined here will get you on your way.
One of the common complaints about Fusion Tables, however, is the lack of map markers.
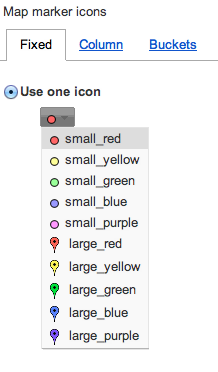
The 10 marker options in Fusion Tables.
Looking in the “Configure styles” menu in the map view of a table gives you 10 options for markers:
- small_red
- small_yellow
- small_green
- small_blue
- small_purple
- large_red
- large_yellow
- large_green
- large_blue
- large_purple
But what do you do if you have more than 10 things you want to represent on the map? What if you are mapping crimes in your city and have more than 10 crime types? Or what if you are mapping community resources and have more than 10 different types?
There are other markers than can be used; they’re just not well publicized. In fact, there are 218 different markers you can use on any Fusion Tables map. The following directions assume some basic knowledge of Google Fusion Tables.
Show me the markers
Using this table as a reference, you can find a marker that works for you. The markers are broken up into four groups:
Pictograms
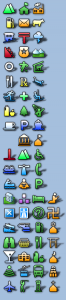
The pictogram markers in Google Fusion Tables.
This set includes pictograms of common things you would find on a map: Ski hills, bus stops, museums, etc., are represented.
Directions
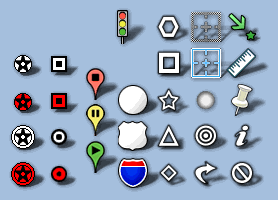
The direction markers available in Fusion Tables.
This set includes icons for directions, such as road signs, starts and stops.
Numbers and letters
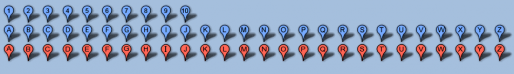
The letters and numbers markers available in Fusion Tables.
This set includes the standard Google Maps marker with a number or letter in each.
Standard markers
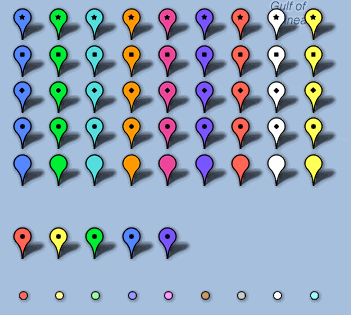
The standard type markers in Google Fusion Tables.
This set is the standard Google Maps markers in a variety of colours. It also includes the smallest (measle) marker.
How to put them on your map
To use the custom markers on your map, you need to make reference to them in your table. You can do this through the addition of a column.
Import your data as you normally would, and geocode it to your map. Check the map view to make sure all your points are showing up where you expect them to be. Once that is done, switch back to the table view. Now create a new column named “icons.” It’s in this new column that you will tell Fusion Tables which marker to render on the map.
Go back to the reference map and choose the marker you want to use. Click on it, and in the popup box that appears, make note of the icon name. It’s that name you’ll need to put into the new column in your table.
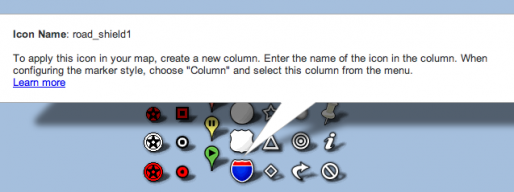
Get the icon name from this popup box.
Do this for each entry in your table. If you have a lot of entries, it would be easier to modify your spreadsheet in Excel, and then reupload the data to fusion tables.
Make sure you get the names right or they will not appear on your map.
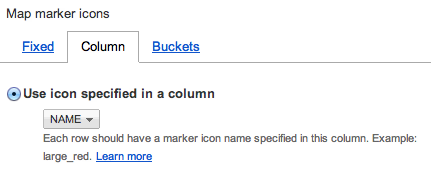
Setting the markers from a specific column.
Switch back to the map view and open the “Configure styles” menu for your table. In the marker icons options, choose “column” instead of “fixed.” Click the radio button for “Use icon specified in a column.” In the drop-down menu that becomes active, choose the column you created that has the marker information stored. Click Save and check your map. If you did everything correctly, you will now have whatever markers you wanted on your map.
Conclusion
As mentioned, easy, quick and adds information and color to your maps.