ONA St. Louis held a night devoted to mapping skills, project and inspirations on May 12. ONA St. Louis Local Leader Kelly Moffitt gathered these takeaways from the discussion.
One of the greatest abilities a journalist has is to explain the lived environment: the context of the place a community makes its home. That was the impetus behind ONA St. Louis’ most recent meetup, which focused on how journalists could incorporate more specialized maps into their reporting and engage the community around place-based concepts.
Think about the importance mapping had in stories like Failure Factories from the Tampa Bay Times, Missing Home from The Lens in New Orleans or One Year in Ferguson from St. Louis Public Radio.

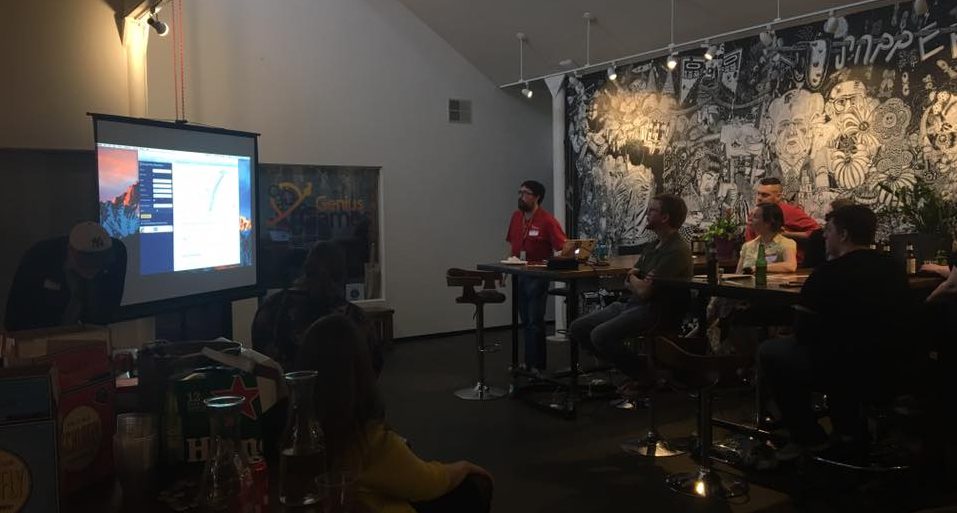
Members of ONA St. Louis gathered for a meetup on maps and mapping. (Photo by Kelly Moffitt)
We did this in three parts: lightning talks, an inspiration session and a practical tools tutorial, including folks outside the journalism world, from GIS-centered careers and MaptimeSTL, a local meetup that works on a community-focused mapping project every year.
Here are some takeaways:
Lightning Talks
Adam Frick, founder of Hugmonster Sound and STL Vernacular, shared UnHeardOf Cherokee Street, a place-based sound project which combines audio of different landmarks icons and the mapping of their locations. He’s using Mapme to host the stories.
Jennifer Reiman of the East-West Gateway Council of Governments and Michael Baer of the St. Louis County GIS Service Center discussed mapping resources of city governments and where to download base layers for maps. For St. Louis County, check out commonly requested maps and this open data website, which includes data and maps to download. You can find regional maps combining County, City and Metro East data through the East-West Gateway Council of Government’s website.
Inspiration
Katie Carpenter from the Center of Creative Arts joined the event to share an innovative pop-up mapping project in St. Louis that recently shuttered: the St. Louis Map Room, which was spearheaded in partnership between COCA and noted data artist Jer Thorpe, who works to make abstract data “more human.”
In an abandoned school in St. Louis, Thorpe set up shop to help community members redraw the maps of St. Louis. To do this, he used 10 x 10 ft. canvas, robots to draw the maps and the work of community groups to draw the maps of their daily lives and how they would like to see those maps change.
During the process, historical data sets and maps could be projected on the maps to give people a sense of demographic change over time, crime statistics, tree numbers and other mapable data.
The pop-up mapping engagement lasted for about a month, but Thorpe plans to produce this kind of work elsewhere in the U.S. Carpenter said the maps created in St. Louis are being saved for later, potentially a display in City Hall, and they were also photographed for a digital archive. May 9 was subsequently declared “St. Louis Map Day” by former Mayor Francis Slay.
What Carpenter learned about coordinating such a large-scale community engagement event that can be applied to journalism:
- Plan earlier and devote more time than you think you need to build partnerships with local schools, non-profits and community groups.
- Create and communicate baseline instructions for map users. Not everyone has the same level of mapping/technology knowledge and may need term definitions.
- Find an advocate at each organization you partner with and make sure you stay in continual contact with that person throughout the course of the project.
Practical Tools
Brent Jones is the data visualization specialist at St. Louis Public Radio and produces maps like this and this. He’s also part of the team that won a 2016 Online Journalism Award for “One Year in Ferguson,” which included mapping components.
Jones gave an introductory presentation on how to utilize mapping tools in digital journalism for the programming-inclined and those who have a bit more work to do in that arena, like me. Check out the slides from his presentation: How maps can help your readers get oriented or hopelessly lost.
Three takeaways from his presentation:
- You can get started mapping quickly by creating a “locator map,” which means putting a point on a map to direct the reader. Brent recommends staticmapmaker.com as a free tool you can use to do this. (Note: Taking a screenshot from Google maps is frowned upon by Google, in the event anything changes in the map between your publish date and how long the story remains online.)
- Context, context, context is key when it comes to making a map. There are so many ways to divide buckets of data onto a map that can really mislead readers, so choose wisely your method of data classification.
- Brent recommended the following applications to assist in the map-making process:
- D3.js (tutorial here, requires programming knowledge)
- Leaflet (tutorial here, requires programming knowledge)
- Google Fusion Tables (tutorial here, minimal to no programming knowledge needed)
- Other members of the group also recommended these applications: Carto DB and Mapbox
 Kelly Moffitt is a producer at St. Louis Public Radio and co-organizer of ONA St. Louis. Born in St. Louis, she returned to the area after a period away in Los Angeles, Moscow and Columbia, wanting to know more about the city she grew up in and serve the community with local journalism. She holds three degrees from the University of Missouri, finally graduating with honors in 2013 with an MA in Journalism, writing a thesis on community engagement efforts in the news. In her spare time, she edits a literary magazine and hikes as many trails as she can find. You can find her on Twitter and Instagram at @kmariemoffitt.