What is it?
Lovely Charts is a web and iPad app that allows the simple creation of flow charts, site maps and other visual representations.
How it works:
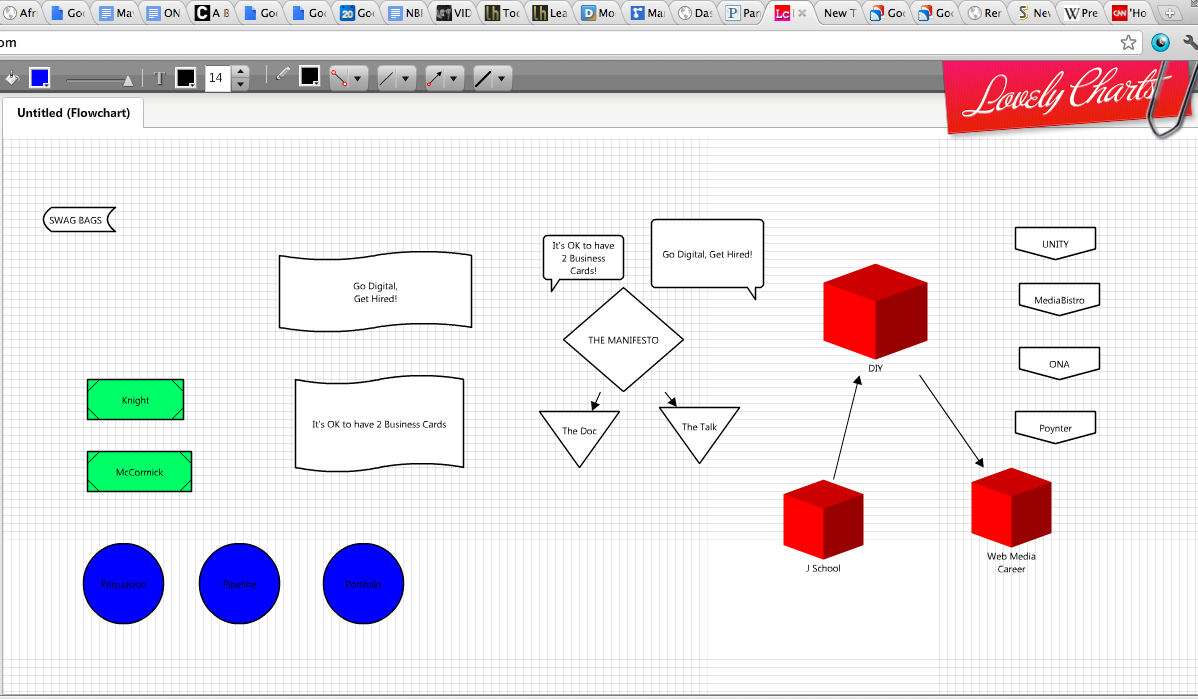
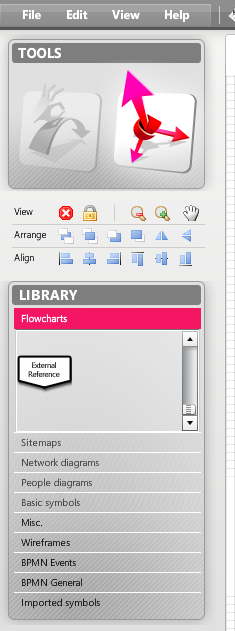
After signing up for an account, users are treated to a 90-second tutorial of the basic functions. After that, it’s playtime – the application is created sandbox-style, so users can drag and drop at will, and scroll through a well-stocked user library. Users drag and drop the key elements onto the screen, and then later switch to Create and Connect Mode, which allows them to make connections between the different elements.
Why it’s cool:
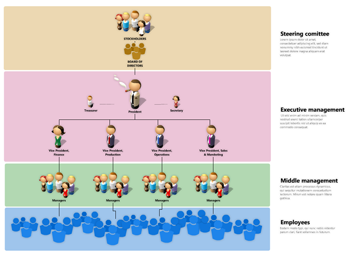
For non artists who still need to convey their ideas in a visual way, the process is simple and easy to understand. And there are some set templates that are majorly helpful to convey ideas to designers. A quick cheat is the “Sitemap” setting, which uses clear images for things like “homepage” and “game,” helping even the most tech-challenged person convey their ideas clearly to a team. Also, the developer’s blog is a fascinating look behind the scenes at the struggles inherent in creating an app.
Real-world application:
Lovely Charts is still a fairly young project, but the gallery displays examples of how the software could be used.
Use it for:
Low-cost design and communication.
Cost:
Free version, with limited functionality. Premium versions start at $6.
Platform:
Web / iPad / Android