 This is one of a series of blog posts from the first ONA class of MJ Bear Fellows describing their experiences and sharing their knowledge with the community. Fellow Lam Thuy Vo is a multimedia journalist based in New York. She previously worked at the Wall Street Journal, where she developed “Dissecting China’s Housing Market,” a project that won the Society of American Business Editors and Writers award.
When I was asked to teach a workshop at Hong Kong University a year ago, I consulted a friend and colleague about what he thought would be the most useful advice for print reporters venturing into the wild territory of multimedia journalism. I was to instruct print freelancers from across Asia in multimedia storytelling, a craft that’s still in its nascence on that continent.
My friend gave me very practical advice. He said that many classes he took in graduate school were very theoretical, and few gave explicit instructions and checklists to students and reporters. When you’re juggling photography, video, data research and good old-fashioned print reporting, there’s nothing that will save your overloaded mind better than a good checklist.
So, I decided to do a case study in the form of a checklist of a multimedia project that took me to Vietnam, China and India. Hopefully, this will be useful to those who are figuring out how to approach extensive multimedia packages.
Food Price Inflation in Asia — A Case Study
This project was an attempt to take a look at volatile food prices across Asia with a specific focus on what drives food prices across the region. We wanted to give viewers an understanding of the subject — both in a broader context and through individual stories in three countries.
1. Pre-Production: Know Your Story
a.) Identify your story/subject:
Multimedia projects often are broad in scope, and at newspapers often are tied to an ongoing series of stories or recurring issues. Production usually takes quite a bit of time and the end product should have a shelf life longer than just a few days to make it worth the effort. Identifying the right subject matter is vital. Make sure you do a thorough Factiva, Lexis-Nexis and web search for earlier coverage of the subject to see whether you can add anything new to the story.
For this project, we wanted to tackle an issue that had crept up in our stories over and over in the past few years: volatile and sometimes frighteningly high food prices. This is a recurring issue for a region where income and population are on the rise. Even though food prices had peaked earlier and are on a downward trend, the United Nations predicted that volatile prices would be an issue for the next 10 years, warranting a closer look.
b.) Break it down:
Multimedia offers a number of avenues for telling a story. You need to understand the main issues before you start figuring out what medium you use to explain it. Sometimes it helps to structure a multimedia project in subjects the way Mediastorm’s Crisis Guides for the Council on Foreign Relations does. Sometimes chronology works, as in the case of the New York Times story “Held by the Taliban.” And sometimes it’s collecting stories from many people, as reporters for the Wall Street Journal did in its piece about health care in the U.S.
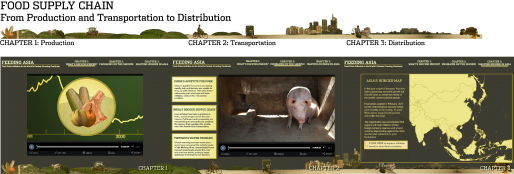
With our project, we wanted to provide a multi-faceted understanding of a complex and international problem. So, we started with a big-picture primer that introduced the audience to the subject and helped them understand why it was important.
Then, we provided three specific stories that identified problems in the food production and distribution chain (production issues caused by pollution and global warming and supply-chain issues, such as the lack of industrialization and supply for growing food demand). This provided concrete examples of how people were dealing with food-price inflation.
Finally, we wanted to show the larger context of these stories: How many countries in Asia were affected by general inflation, how much of their income people spend on food and how many people in those countries were undernourished.
2. Conceptualizing: Decide What to Report Before You Go
a.) Identify a medium for each part of the story:
This means that you should, as much as possible, get an idea of how the end product should look. Once you’ve broken down your project, you can concentrate on casting the right medium for each part of the story (I’ve written a lengthy breakdown of what I think the different strengths of different mediums should be).
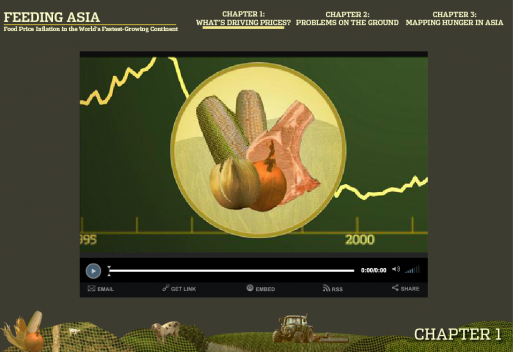
For this project, a narrated and animated infographic worked well as an introduction:
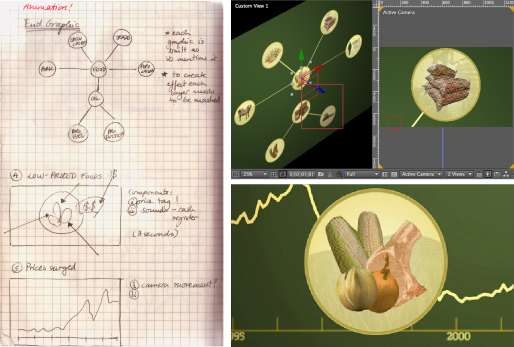
The planning of an animation — from storyboarding, to production, to finished product.
Watch the animation here.
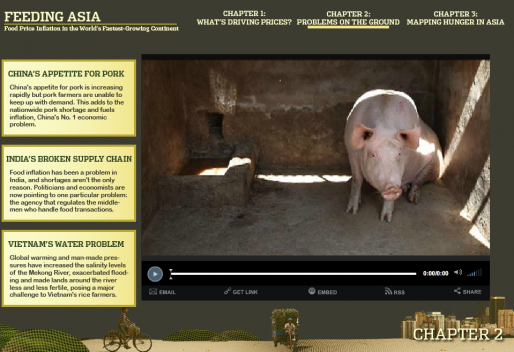
Three video features displayed “on-the-ground” stories:
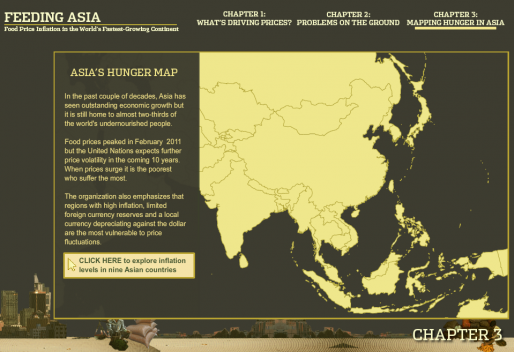
And an interactive graphic provided numerical context:
b.) Make a list of what you need
Once you know the types of story elements you need, you should put together a scavenger-hunt list of content you want to gather. Multimedia is not like print journalism: You can’t just call a source and ask for information and materials you forgot to request earlier. If you didn’t capture the information on video or get a photograph of someone, it can be very difficult to get what you need, especially when you are on deadline.
This is why checklists are essential. You might need to ask your sources for addresses so that you can create a map or to pose for a picture if you need images for a series of interviews.
For this project, I wanted to use a small, decorative collage to capture the entire process of the food chain — from production in the countryside, to the transportation, to the markets and, finally, to the selling of food. Part of my checklist was capturing images from the journey that food makes from the farmers to the markets that were later used for a collage that illustrated the journey.
See a breakdown of the collage here:
3. Production
Last, but not least, comes the task of production. If you’ve been organized about the entire reporting process, you can now start tackling the elements one by one. You might want to start with the individual elements (videos, infographics and animations) and then work your way toward curating these elements in a shell.
Production timeline:
Here’s a breakdown as to how long it took to create and produce this project:
- July-August: Researching the project
- September: Traveling and reporting
- October: Production and testing
- Early November: Launch