 This post is one of a series of blog posts from the first ONA class of MJ Bear Fellows describing their experiences, projects and sharing their knowledge with the ONA community. Fellow Lucas Timmons is a data journalist and web producer for The Edmonton Journal in Edmonton, Alberta, Canada.
“I became a journalist so I didn’t have to do math.”
You hear this far too often in newsrooms. Many journalists shy away from math because it can be difficult. There’s also a hint of underlying pride in not being able to do math. But not knowing something shouldn’t be a point of pride for any journalist.
The lack of basic math literacy can lead to shoddy journalism. This is a problem not just in pure math, but also in statistics. As Slate’s Libby Copeland recently pointed out, a misunderstanding of what numbers mean results in stories and headlines that don’t accurately portray what studies mean.
With that in mind, here is some basic math every journalist should know … and something to watch out for.
1. Percentage change
What is it?: A simple formula to determine a change between two numbers based on the first.
Practical applications: Use it to compare changes in home prices, political donations, gender in university admittance, calculate the change in purchasing power.
In order to see how much a number has changed, use the following formula:
((x - y) / y)*100
Where y is your original value and x is your new value. If the answer is less than zero it’s a decrease. If it’s greater than zero, it’s an increase.
What is the percentage increase from 25 to 75?
((75-25)/25)*100

(50/25)*100

2*100

200
The change from 25 to 75 is a 200 percent increase.
This also works in decreases. What is the percentage decrease from 75 to 25?
((25-75)/75)*100

(-50/75)*100

(-0.66)*100

-66
The change from 75 to 25 is a 66 percent decrease.
Something really important to note here: The percentages are determined from your initial value. An example from Darrell Huff’s classic, “How to Lie with Statistics,” demonstrates this perfectly.
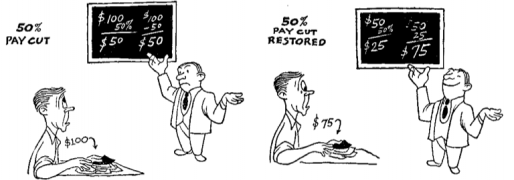 From Darrell Huff’s How to Lie with Statistics
A 50 percent pay cut from $100 makes your wage $50. A 50 percent pay increase from that $50 is only $25. The numbers started from different values so won’t produce the same results.
Or as this Dilbert cartoon points out, the change from 75 to 100 is 33 percent, not 25 percent, as would be easily assumed.
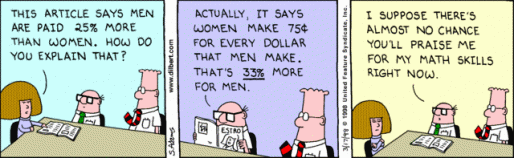 From Dilbert.com
((100-75)/75)*100

(25/75)*100

(.33)*100
The change from 75 to 100 is a 33 percent increase.
2. Simpson’s Paradox
What is it?: A common mistake in interpreting data that can lead to wrong conclusions.
Practical applications: Use it to ensure your conclusions are sound before writing or conducting interviews.
Simpson’s Paradox has nothing to do with Homer or Bart. It happens when an association between a pair of variables is reversed because of a change in a third variable. If you aren’t careful with your interpretation of data, you could fall into this trap.
Take this example from Ken Ross’ “A Mathematician at the Ballpark: Odds and Probabilities for Baseball Fans.”
In 1995, Derek Jeter was making his Major League debut and David Justice was six years into his career. Jeter hit .250 that season and Justice .253. In 1996, both did much better at the plate. Jeter hit .314 and Justice .321.
Which player was the better batter over those two years?
It would be easy to conclude Justice was better because he had a higher batting average both years. You could combine his averages and divide by two to get a mean of .287 over those two years. Jeter’s would then be .282. If you did that, however, you are making assumptions about the data and how it’s weighted — assumptions that would cause you to come up with the wrong results.
In reality, the better choice was Jeter. But why? Let’s take a closer look at the numbers.
Jeter his .250 in 1995. That was 12-for-48 at the plate. He hit .314 in 1996, or 183-for-582.
Justice hit .253 in 1995. That’s 104-for-411. He hit .321 in 1996, or 45-for-140.
Overall, Jeter hit 195-for-630 and Justice hit 149-for-551. That’s a .310 average for Jeter and a .270 average for Justice! Even though it appeared Justice was better both years, Jeter was better overall. Simpson’s Paradox.
In this case, it happened because there was a large difference in the number of at-bats per year.
James Grime, AKA Singingbanana. has made a great video demonstrating Simpson’s Paradox. As a matter of fact, check out all his videos for other really interesting math-related things.
Don’t be scared of math. It’s a strong storytelling tool that journalists need to embrace and use to do their jobs better. Enhancing your math literacy will help you avoid embarrassing mistakes. And find and tell better stories.
What do you think? Do journalists do enough math? Should math be taught in J-schools? Let me know in the comments.